Welcome to Random Time where I share something unrelated to car audio, but still pretty interesting. Today’s topic is how to find shift optimal points using an excel spreadsheet I made.
If this helps you out, let me know with a donation. I would really appreciate it. Just select the amount and click on the “Donate” logo. I spent a lot of time on this. Also, if you need help with anything, leave a comment below or sent me an email: [email protected]. Thanks!
Why not just shift at redline?
You might be wondering why you need to know where to shift when there’s that nice red line on the tach showing you were to shift. The answer: because redline isn’t always the most optimal shift point. The way an engine makes torque and gear ratios have a lot to do with this.
How to find optimal shift points
I made an excel spreadsheet to calculate the best shift points for your car. The trick is you need to do a little research and googling to find a few input parameters.
Download and open this spreadsheet to follow along (click here).
Everything in gray boxes on the spreadsheet is what you need to input yourself. Everything else will be calculated for you.
Step 1
First you need to find the gear ratios and redline rpm for your vehicle. Google will probably be your best bet here, or if you have a Subaru up to model year 2007 there is a link in the file to gear ratios since I used a 2006 STi for the example in the spreadsheet. Enter all of this in the gray boxes on the ‘Car Spec’ sheet of the file.
Step 2
Click on the Tire Size Calculator link either here or in the spreadsheet. This will bring you to discounttire.com’s calculator. Input your tire specs here and take the “Revs per mile” result from there and input it into the last gray box on the ‘Car Specs’ sheet of the file.
Step 3
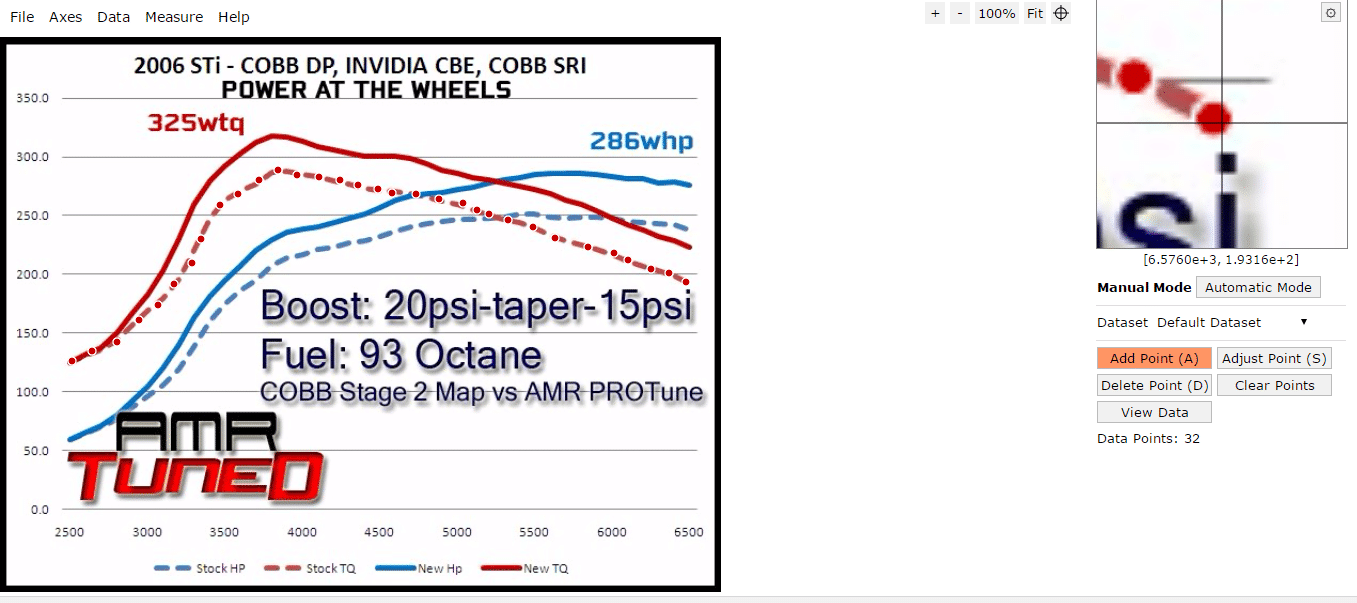
You will need a dyno graph of your car for this step, or you can find one on google for a car with similar mods. If your car is extremely modified, chances are you already have on of these. This is the trickiest part, but once you play around with it some, you’ll get the hang of it.
Click on the Plot Dyno Using WebPlotDigitizer link either here or in the spreadsheet.
- Go to file->load image
- Upload the image of your dyno graph
- A “Choose Plot Type” box will pop up. Make sure “2D (X-Y) Plot” is selected and click “Align Axes”
- A little how-to will popup explaining how to define your axes. Click “Proceed”
- Now select one point on the X-axis (horizontal axis) close to the origin. You will notice a magnified box at the upper right of the screen. Try to get it as close on the line of the actual X-axis on your graph as possible and at a legible rpm
- Select a second point on the X-axis using the same technique further down towards the end of your graph, again at a legible rpm
- Your third click here will be the first point of your Y-axis. Do like you did for the X-axis selecting a legible torque value
- The fourth and final click for defining the axes will be your second Y-axis point. Do the same as above
- It should look similar to this:

Dyno graph from AutoMaster at iwsti.com - On the right of the screen, click “Complete”
- It will pop up with a calibration screen. Remember I said pick legible points? Input those here in the correct order
- For my example above:
- X-Axis Point 1 = 3000
- X-Axis Point 2 = 5500
- Y-Axis Point 1 = 100
- Y-Axis Point 2 = 300
- This is why I say pick legible points
- For my example above:
- Now on the ride side, make sure “Add Point (A)” is selected.
- Input 32 data points following along the torque curve. This is very important to input exactly 32 data points, or the excel file won’t function properly.
- It should look similar to this:

- It will take a while playing around with this since you need an exact number of data points. Sorry about that. But be sure to put them all in order from low rpm to high rpm (x-axis values). You can use the “Adjust Points (S)” option to move them further apart, etc. to get them where you need them (but I think it’s just easier to “Clear Points” and restart); just keep them in order!
- It should look similar to this:
- Once you input 32 data points along the torque curve, click on “View Data”
- The data will pop up in a screen. Click on “Download .CSV”

Step 4
Open up the new .csv file you downloaded of your data points. Copy and paste these values in the gray “RPM” and “Tq (lb-ft)” columns on the ‘Dyno’ sheet of the Tractive Force excel file. Note: In the .csv file you downloaded, the first column will be rpm and the second will be torque, so you can copy and paste both columns at the same time into the spreadsheet
You can do the same for the horsepower curve like I did, but it’s just to make the excel sheet look pretty and give you peak hp numbers
Now look at the graph on the ‘Dyno’ sheet of my excel file and make sure it looks similar to your dyno graph. It may be off due to scaling, but make sure it follows roughly the same curve. If not, try the above steps again and make sure everything was put in properly.
Step 5
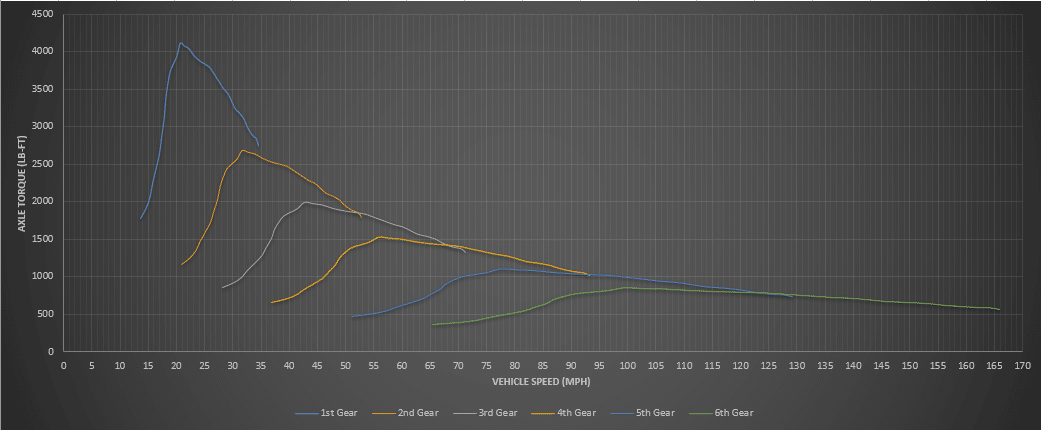
The next sheet, ‘Tractive Force Graph’ is where the magic happens. This is how you will find out what speed to shift at.

Notice in my example each curve represents a different gear. The green circle shows where 2nd gear intersects 3rd gear. This intersection occurs at around 52 mph. That means shift at 52 mph from 2nd to 3rd.
Why is this the optimal shift point? Well when the second gear curve drops below the 3rd gear curve that means your torque in 2nd is less than what your torque would be in 3rd gear.
So to find shift points for all gears using my example:
- 1st – 2nd gear shift: At redline because the first gear torque curve never drops below the 2nd gear curve. Therefore, you need all of 1st gear. 34 mph
- 2nd – 3rd gear shift: This is the example from above: 52 mph
- 3rd – 4th gear shift: 68 mph
- 4th – 5th gear shift: 93 mph
- 5th – 6th gear shift: Slow down you’re going too fast! Or 122 mph
Step 6
Now you can convert those speeds to rpm by using the ‘Tractive Effort’ sheet. For example, for 5th gear we want to shift at 122 mph. Find the 5th gear section on this sheet and look for 122 mph. You will have to do a little guessing for this part, but it will be close enough for all intents and purposes. 122 mph equates to right about 6200 rpm:

Notice that this is 300 rpm below redline. Due to the gearing on this car, it actually helps to short shift the 5-6 shift by a few hundred rpm.
Using this technique for all gears:
- 1st – 2nd gear shift: 6500 rpm (redline)
- 2nd – 3rd gear shift: 6500 rpm
- 3rd – 4th gear shift: 6300 rpm
- 4th – 5th gear shift: 6500 rpm
- 5th – 6th gear shift: 6200 rpm
Sorry these numbers aren’t calculated already for you, but that was beyond my excel expertise.
Conclusion
That’s how you find your shift points using this excel sheet. I know it’s not that straight forward but beats hand calculations any day.
Notice the gear ratios in the stage 2 2006 STi example car were pretty well designed from Subaru to let you wring out each gear to redline. You will probably notice the same for a lot of other cars. If so, great! That makes it easier for you to remember when to shift. Once you start doing some pretty crazy modifications or changing gear ratios, that is when you will probably find this of the most importance.